Data quality monitoring is the continuous measurement of your data against explicit rules, so a broken number is caught before it reaches a dashboard, a ledger or a customer. It works when three things are in place: a small set of checks tied to business-critical data, thresholds with named owners, and monitoring built into the systems that move the data rather than bolted on afterward. Teams that build custom platforms, such as financial systems, workflow automation or blockchain settlement, get the most from designing these controls into the architecture from the start.
This guide covers what to measure, where to place checks, how to set thresholds that do not drown the team in alerts, and how to build a framework with ownership.
TL;DR
- Data quality monitoring checks production data continuously against rules for accuracy, completeness, consistency, timeliness, validity, uniqueness and integrity.
- Start with three to five foundational checks (nulls, key uniqueness, freshness, volume) on your most critical datasets, then add business-logic rules.
- Place checks at natural failure boundaries: source interfaces, staging, transformations and final data products.
- Every rule needs an owner and a concrete threshold. Alerts that never lead to action should be tuned or removed.
- For systems that handle money, build monitoring and audit trails into the platform itself, not around it.
What data quality monitoring measures
IBM defines the practice as assessing, measuring and managing data in terms of accuracy, consistency and reliability, and lists seven dimensions it addresses. Each dimension is a question you can turn into a check:
| Dimension | The question it answers | Example metric |
|---|---|---|
| Accuracy | Does the value match reality or an authoritative source? | % of records reconciled against a source of truth |
| Completeness | Is everything required present? | % of non-null values in a required column |
| Consistency | Do systems and related fields agree? | Number of conflicting records across systems |
| Timeliness | Is the data current enough for its use? | Hours since the last successful update |
| Validity | Does it follow the required format and rules? | % of rows matching an allowed format or range |
| Uniqueness | Is each entity recorded once? | Count of duplicate business keys |
| Integrity | Do relationships between tables hold? | Number of broken references |
The U.S. federal HIT Playbook uses a similar list of nine dimensions, adding accessibility, coverage and conformity. Its examples are practical: conformity means data aligns with a required standard such as a fixed date format, and uniqueness means a record can be identified unambiguously, for instance by a unique patient ID rather than a name plus birth date.
You do not need every dimension on day one. Pick the ones whose failure would cost you money, compliance standing or customer trust. For a payments platform that usually means accuracy, uniqueness (no duplicate transactions), integrity and timeliness. For a CRM it is typically completeness and uniqueness.
Monitoring versus one-time testing
A test runs once, usually before release, against sample data. Monitoring runs continuously against production data, where the surprises live: a partner changes a payload, a batch job runs late, an upstream team changes a unit. Both belong in a mature setup, but only monitoring tells you what happened last night.
Where to place checks in the pipeline
Data rarely fails where it is consumed. It fails earlier and surfaces later. Placing checks at stage boundaries makes the failure visible where it starts.
Ataccama describes three positions for validation: at the source, in motion inside pipelines, and at rest in the warehouse. Validation at the source is the most effective and the hardest to get, because you rarely control every system that creates records. In motion, a batch job can hold back rows with malformed identifiers. At rest, anomaly and trend monitoring catches patterns such as total order value dropping by a third because an upstream change started sending cents instead of dollars.
A practical layout maps risks to stages:
- Ingestion. Check API response codes, file arrival patterns and basic structure. Typical failures: missing records, late data, schema shifts.
- Staging. Check raw-data completeness, schema drift and uniqueness of business keys.
- Transformation. Check calculation accuracy, referential integrity and business logic. Typical failures: logic errors, null propagation, broken joins.
- Data products. Check metric consistency, business rules and usage patterns. Typical failures: dashboards that disagree, stale datasets.
This boundary-based approach follows Acceldata’s end-to-end setup guide, which pairs it with lineage tracking so each alert points to where the problem began. The same logic applies to structured fields outside the warehouse: a structured data markup audit is a schema-validation check on web content, and it shows how a rule written once can be run repeatedly against changing inputs.
Check the analytics layer too
Pipeline health is not the same as correct numbers. Join fan-out, silent filter drops and changed metric definitions can all produce a clean pipeline run and a wrong figure. Basedash recommends measuring quality at the analytics layer for this reason, and notes that a handful of scheduled SQL checks with thresholds on a single dashboard covers much of the value for a lean team.
Which checks to automate first
The most common failure in monitoring programs is starting too wide. Atlan’s documentation recommends beginning with three to five foundational checks, namely nulls, uniqueness on keys, and freshness or volume, before adding business-logic rules. Column-level rules fit field-specific criticality, while table-level rules suit freshness, row count and volume.
A sensible first set for a transactional system:
- Freshness: the table was updated within its expected window.
- Volume: today’s row count is within a tolerance of the same weekday in recent weeks.
- Key uniqueness: duplicate transaction or customer IDs equal zero.
- Required fields: null rate on amount, currency, timestamp and account identifier is at or near zero.
- Referential integrity: every transaction references an existing account.
Once these run reliably, add the rules that encode your business: totals reconcile between ledger and subledger, currency codes belong to the supported list, status transitions follow the allowed order.
Rules, not wishes
Alation’s rollout guidance stresses concrete thresholds such as “duplicate customer IDs equals zero” over vague goals, an owner for every rule, and enough context in each alert to act: what failed, what is affected downstream and who is accountable. It also suggests prioritizing alerts by downstream usage, lineage position, how critical the consuming process is, the blast radius if the data is wrong and how fast the data changes.
Metrics that show whether it is working
There are two kinds of metrics: those that describe the data and those that describe the monitoring program.
Data metrics come from the dimensions above. IBM gives two simple ones: the error ratio, which is records with errors divided by total entries, and the duplicate record rate, which is the share of duplicate entries compared with all records. Run each as a query on a schedule and compare it with a threshold.
Program metrics show whether monitoring changes outcomes:
- time to detection, how long a problem lives before someone knows;
- time to resolution;
- quality incidents per quarter;
- coverage, meaning the share of critical assets with defined thresholds and active monitoring.
Coverage matters more than a single overall quality score. A score of 98% across data nobody uses says little, while 100% coverage of the datasets that feed financial reporting says a lot.
Thresholds and alerts that people trust
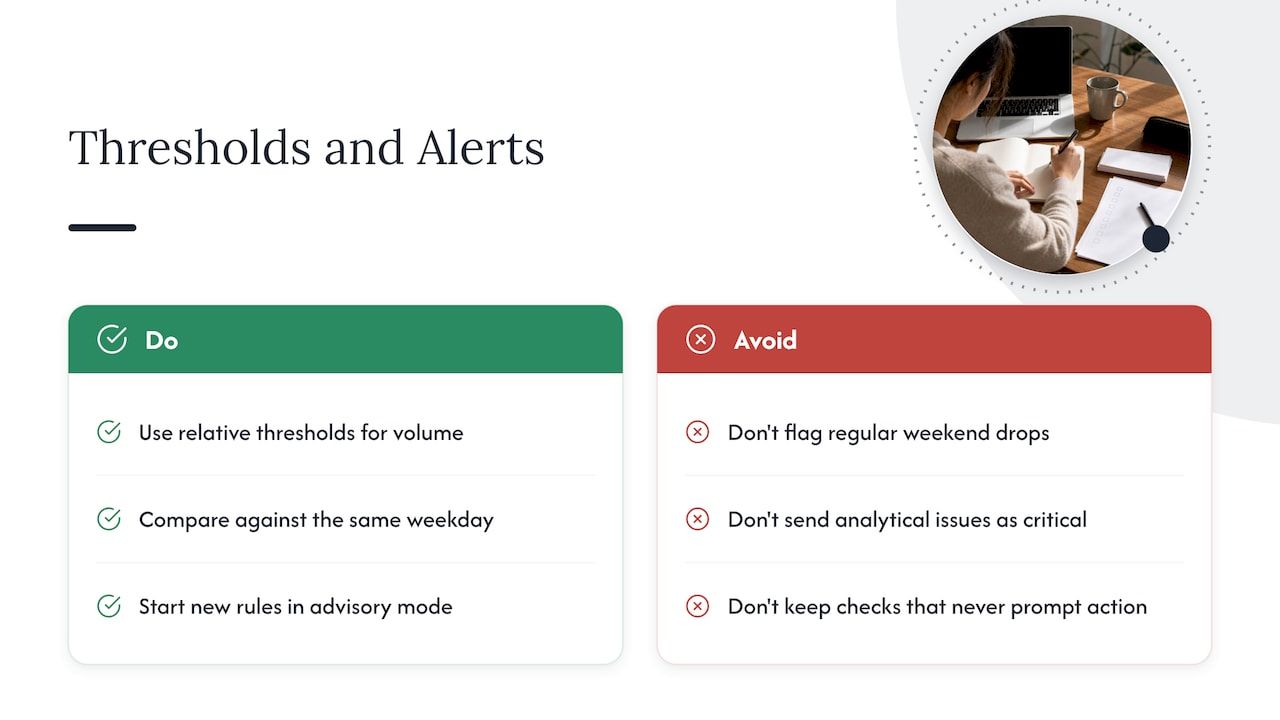
Alert fatigue ends more monitoring programs than missing technology does. Atlan’s published analysis of data quality alerts reports that teams receiving more than 50 alerts a week see engagement fall, with a further decline above 100. The remedy is design, not discipline.
Use the right kind of threshold. Relative thresholds suit volume, for example within a set percentage of a rolling baseline. Absolute thresholds suit invariants, such as zero duplicate keys or zero null account IDs.
Respect seasonality. A volume drop that happens every weekend is not an anomaly. Compare against the same weekday, or use anomaly detection that learns the normal pattern, so the check flags real deviations only.
Tier by severity. Reserve critical alerts for data that drives regulated or customer-facing processes. Send analytical-layer issues to a lower channel. Start new rules in advisory mode, observe for a couple of weeks, then promote them.
Measure alert precision. Track the share of alerts that led to action. A check that never leads to action is either mis-tuned or unnecessary, and should be adjusted or removed.
From detection to remediation
Finding an issue is the easy half. A framework earns its name when each finding has a path to a fix. A workable loop:
- Monitoring raises an alert and creates a task for the responsible owner.
- The owner traces the issue upstream using lineage.
- The root cause is identified.
- The fix is applied at the source, not downstream.
- The rule or threshold is updated if it missed the problem or fired too late.
- The resolution is documented against the affected asset.
Without step four, teams patch symptoms in reports and the same defect returns next quarter. Without step six, the next engineer starts from zero.
Ownership
Assign three roles explicitly: a business owner who defines what “correct” means, a technical owner who maintains the pipeline and rules, and a steward who triages alerts. When a rule has no named owner, it has no owner in practice.
Automation: what it does and where it needs judgment
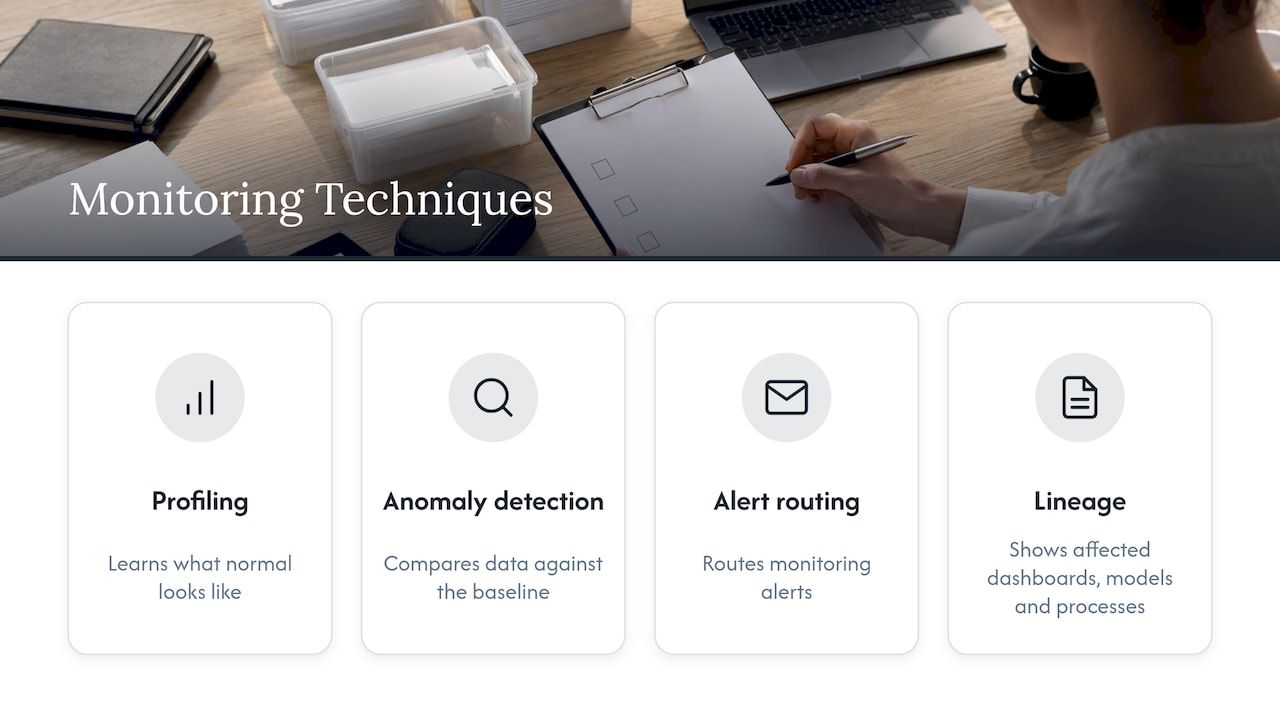
Automated monitoring typically combines several techniques: profiling to learn what normal looks like, statistical or machine-learning anomaly detection against that baseline, alert routing, and lineage to show which dashboards, models and processes a failure affects. Databricks’ overview of data observability describes this signal-gathering model: table updates, query logs, job status, schema metadata, row counts and dependency graphs feed baselines and impact analysis.
Automation removes repetitive checking, but the rules still reflect business decisions. A machine can tell you that refund volume doubled. Only your team can say whether that is a campaign, a fraud wave or a bug. That is why ownership and thresholds come first, and tooling second.
Monitoring in systems that handle money
For finance, fintech and settlement platforms, data quality is a control, not a convenience. Duplicate postings, currency mix-ups and late feeds become reconciliation breaks and audit findings. Three design principles help:
- Make quality checks part of the pipeline contract. Rows that fail validation are quarantined with a reason code instead of silently dropped or silently loaded.
- Keep an evidence trail. Every check result, rule version and override should be stored so an auditor can reconstruct what was known at the time. Our guide to audit trail design covers testable patterns for this.
- Reconcile at the boundaries. Compare totals between systems at each hand-off, which is where multi-currency and multi-ledger setups most often drift.
If you are designing the pipeline itself, four guarantees for audit-ready finance data pipelines goes deeper on idempotency, lineage and controls. For the governance layer on top, see our piece on continuous control monitoring, and for warehouse-side practice, data warehouse automation.
A 90-day rollout
Days 1 to 30: scope. List the datasets behind your revenue, regulatory reporting and customer-facing decisions. Rank them by business impact. Pick the top handful and define what a failure would cost.
Days 31 to 60: baseline and pilot. Profile the chosen datasets against recent history, write the foundational checks, and run them in advisory mode. Record every alert and whether it was useful.
Days 61 to 90: enforce and expand. Promote precise rules to real alerts with owners and severity tiers, wire alerts into the channels the team already uses, and publish coverage, time to detection and time to resolution. Review rules quarterly so thresholds follow the business.
Our perspective
Most data quality problems we see discussed are treated as tooling problems. We treat them as architecture problems. If validation, reconciliation and audit logging are designed into the system at the start, monitoring has something solid to observe. If they are added later, the team spends its time compensating for gaps.
This is why we build custom enterprise systems from modular, ready-made components, with up to 60% of the baseline system pre-built. Financial processing, workflow automation and audit-ready behavior are part of the foundation, so the engineering effort goes into your domain rules, the part that is unique to your business, rather than into rebuilding plumbing.
Our approach also keeps control with the client, including self-hosted modules, so the data and the rules that govern it stay under your roof. For teams in finance, fintech or blockchain settlement, that is the difference between monitoring that is demonstrable to an auditor and monitoring that is a promise.
Bitecode
Build quality controls into your next system
If you are planning a financial platform, an internal system or an automation workflow, the cheapest time to add data quality controls is the design phase. We build custom business software from modular components, including a Financial Module with accounting and audit capabilities and AI business process automation workflows, so validation and monitoring are part of the first release.
To discuss your scope, start from our custom business software page.
FAQ
What is the difference between data quality checks and data quality monitoring?
A check is a single rule, such as “no null account IDs.” Monitoring is the ongoing system that runs many checks on a schedule, compares results with thresholds, routes alerts to owners and tracks trends over time. Checks are the building blocks, and monitoring is what makes them continuous.
How many data quality metrics should we track?
Fewer than you think. Begin with completeness, uniqueness and freshness on your most critical datasets, then add validity and consistency rules as you learn where failures actually occur. Add program metrics such as time to detection and coverage so you can show progress.
Do we need a dedicated tool, or can we start with SQL?
A handful of scheduled SQL checks with thresholds on one dashboard is a sound start for a small environment. As the number of tables grows into the hundreds, automated anomaly detection, lineage-aware alerting and ownership workflows become worth building into the platform.
How do we avoid alert fatigue?
Tier alerts by business impact, use absolute thresholds only for true invariants, compare volumes against the same weekday or a rolling baseline, and track the share of alerts that lead to action. Retune or retire any check that never does.
Who should own data quality?
Shared ownership with clear roles works best: a business owner defines correctness, a technical owner maintains pipelines and rules, and a steward triages alerts. Every rule should have a named owner.
Sources
- IBM: What is data quality monitoring?
- HIT Playbook: Data quality assessment
- Ataccama: Where data quality belongs in the data value chain
- Acceldata: End-to-end data quality monitoring setup guide
- Basedash: Data quality metrics, what to measure
- Atlan documentation: Plan and run data quality monitoring
- Alation: Automated data quality explained
- Atlan: Data quality alerts
- Databricks: What is data observability?